| ............. |
|
This article was first posted on July 1, 2002, updated on May 1, 2014.
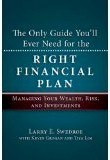
Looking back over the past nineteen years, I thought it might be interesting to see how some popular investment strategies have fared since I quit work in November 1994. During that time, we've seen a five year bull market, a three year bear market, and another bull market where the S&P500 and Dow reached new all-time highs in October 2007. In the past six years we've seen another 50% plunge in stock values followed by a significant recovery with the Dow continuing to hit all-time highs in since early 2013. The NASDAQ continues to lag at a about 85% of its year 2000 peak. The good news is that anyone with a reasonably diversified portfolio did just fine. It's not bad news, but, of course, some strategies performed better than others. The chart below shows the results for a $100,000 starting balance and a 4% of assets initial withdrawal indexed annually for inflation. Vanguard index funds are used whenever possible in this analysis. If you want to check the calculations, you can download the Excel spreadsheet, click here.
![[Chart]](reallife14.jpg)
Only the 100% Fixed Income portfolio showed a loss for 2013. It lost 4.5% of its value as interest rates remained low while the inflation-adjusted retirement withdrawal continued to grow. The other seven all showed gains of 6% to 25% for 2013. Over the nineteen-year period the three Concentrated Portfolios have kept their lead with Harry Dent, Warren Buffett, and Harry Browne posting one, two, three. The three broadly diversified portfolios (Retire Early, One-Fund, and MPT) and the Larry Portfolio are grouped in the middle, while the 100% fixed income portfolio is in last place, lagging badly over the nineteen-year period.
The inflation rate as measured by the CPI-U was 1.57% in 2013, almost identicle to the 1.59% figure in 2012.
|
Real-Life Retiree Returns
Dec 31 Portfolio Values, $100,000 starting balance,
4% initial inflation-adjusted withdrawal rate |
| Year |
1994 |
1995 |
1996 |
1997 |
1998 |
1999 |
2000 |
2001 |
2002 |
2003 |
2004 |
2005 |
2006 |
2007 |
2008 |
2009 |
2010 |
2011 |
2012 |
2013 |
2014 |
75% S&P500/
25% FI |
$100,000 |
$125,756 |
$144,002 |
$176,904 |
$212,405 |
$242,766 |
$226,770 |
$206,254 |
$170,402 |
$202,477 |
$214,253 |
$218,057 |
$240,383 |
$247,872 |
$172,849 |
$205,417 |
$224,165 |
$222,419 |
$244,461 |
$296,116 |
N/A |
One Fund
60%/40% |
$100,000 |
$123,494 |
$136,040 |
$161,119 |
$184,810 |
$204,995 |
$196,412 |
$185,982 |
$163,993 |
$190,782 |
$203,194 |
$207,331 |
$224,320 |
$232,420 |
$176,429 |
$205,058 |
$225,458 |
$228,688 |
$247,883 |
$285,052 |
N/A |
| 100% Fixed Income |
$100,000 |
$107,965 |
$108,851 |
$111,824 |
$114,537 |
$113,875 |
$118,237 |
$122,642 |
$123,916 |
$123,925 |
$121,459 |
$118,982 |
$119,373 |
$120,647 |
$109,909 |
$118,359 |
$118,227 |
$114,450 |
$113,296 |
$108,166 |
N/A |
| MPT Portfolio |
$100,000 |
$115,671 |
$127,214 |
$141,641 |
$146,591 |
$162,437 |
$161,756 |
$156,527 |
$141,155 |
$169,045 |
$184,450 |
$192,438 |
$214,734 |
$218,900 |
$161,639 |
$193,632 |
$212,531 |
$203,755 |
$221,658 |
$250,270 |
N/A |
| Warren Buffett Portfolio |
$100,000 |
$140,120 |
$144,022 |
$178,711 |
$245,434 |
$207,327 |
$247,230 |
$258,910 |
$249,963 |
$276,444 |
$284,813 |
$283,087 |
$331,498 |
$401,128 |
$297,713 |
$306,655 |
$352,525 |
$335,778 |
$375,001 |
$442,774 |
N/A |
| Harry Browne Portfolio |
$100,000 |
$110,778 |
$135,564 |
$156,784 |
$195,699 |
$269,874 |
$300,891 |
$350,527 |
$325,414 |
$310,443 |
$347,754 |
$386,571 |
$406,019 |
$441,268 |
$332,216 |
$336,572 |
$421,395 |
$406,273 |
$388,833 |
$414,116 |
N/A |
| Harry Dent Portfolio |
$100,000 |
$131,349 |
$155,859 |
$180,948 |
$246,282 |
$298,324 |
$342,689 |
$307,762 |
$257,469 |
$330,648 |
$342,559 |
$360,998 |
$392,549 |
$405,623 |
$279,572 |
$371,125 |
$402,612 |
$385,095 |
$437,455 |
$548,612 |
N/A |
| Larry Swedroe Portfolio |
$100,000 |
$108,691 |
$124,340 |
$140,841 |
$139,895 |
$148,299 |
$174,219 |
$167,492 |
$147,870 |
$152,492 |
$178,147 |
$186,860 |
$204,802 |
$212,176 |
$195,186 |
$170,712 |
$202,248 |
$204,337 |
$208,953 |
$239,283 |
N/A |
| .
|
|
Constant Dollar Results
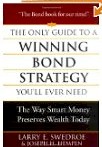
If we adjust the table and plot above for inflation and show the results in constant dollars, the December 31, 2013 portfolio values are reduced by about one-third. While Harry Browne, Harry Dent and Warren Buffett more than doubled in inflation-adjusted terms, the other four equity-based portfolios only showed a 54% to 90% gain. The 100% fixed income portfolio lost more than one-quarter of its value in constant dollar terms over the past nineteen years.
![[Chart]](reallife14c.jpg)
Real-Life Retiree Returns
Dec 31 Portfolio Values (constant dollars), $100,000 starting balance,
4% initial inflation-adjusted withdrawal rate |
| Year |
1994 |
1995 |
1996 |
1997 |
1998 |
1999 |
2000 |
2001 |
2002 |
2003 |
2004 |
2005 |
2006 |
2007 |
2008 |
2009 |
2010 |
2011 |
2012 |
2013 |
2014 |
75% S&P500/
25% FI |
$100,000 |
$122,416 |
$136,037 |
$164,534 |
$194,306 |
$216,159 |
$194,652 |
$175,042 |
$140,955 |
$164,321 |
$168,997 |
$165,274 |
$178,506 |
$176,497 |
$123,041 |
$142,483 |
$152,990 |
$147,484 |
$159,556 |
$190,424 |
N/A |
One Fund
60%/40% |
$100,000 |
$120,215 |
$128,515 |
$149,852 |
$169,062 |
$182,528 |
$168,594 |
$157,821 |
$135,653 |
$154,830 |
$160,147 |
$157,145 |
$166,578 |
$165,495 |
$125,589 |
$142,234 |
$153,873 |
$151,642 |
$161,789 |
$183,170 |
N/A |
| 100% Fixed Income |
$100,000 |
$105,098 |
$102,830 |
$104,005 |
$104,777 |
$101,395 |
$101,491 |
$104,083 |
$102,502 |
$100,572 |
$95,728 |
$90,181 |
$88,645 |
$85,897 |
$78,238 |
$82,097 |
$80,689 |
$75,891 |
$73,946 |
$69,505 |
N/A |
| MPT Portfolio |
$100,000 |
$112,599 |
$120,177 |
$131,737 |
$134,100 |
$144,634 |
$138,846 |
$133,170 |
$116,761 |
$137,189 |
$145,374 |
$145,857 |
$159,459 |
$155,850 |
$115,061 |
$134,309 |
$145,050 |
$135,108 |
$144,673 |
$160,819 |
N/A |
| Warren Buffett Portfolio |
$100,000 |
$136,399 |
$136,056 |
$166,214 |
$224,521 |
$184,605 |
$212,214 |
$219,730 |
$206,767 |
$224,350 |
$224,475 |
$214,564 |
$246,167 |
$285,596 |
$211,924 |
$212,704 |
$240,595 |
$222,652 |
$244,757 |
$284,519 |
N/A |
| Harry Browne Portfolio |
$100,000 |
$107,836 |
$128,066 |
$145,820 |
$179,023 |
$240,296 |
$258,275 |
$297,483 |
$269,178 |
$251,941 |
$274,082 |
$292,999 |
$301,505 |
$314,206 |
$236,484 |
$233,456 |
$287,598 |
$269,397 |
$253,785 |
$266,104 |
N/A |
| Harry Dent Portfolio |
$100,000 |
$127,861 |
$147,238 |
$168,295 |
$225,296 |
$265,629 |
$294,152 |
$261,189 |
$212,976 |
$268,339 |
$269,988 |
$273,616 |
$291,502 |
$288,791 |
$199,011 |
$257,422 |
$274,778 |
$255,354 |
$285,520 |
$352,529 |
N/A |
| Larry Swedroe Portfolio |
$100,000 |
$105,805 |
$117,462 |
$130,992 |
$127,974 |
$132,046 |
$149,544 |
$142,146 |
$122,317 |
$123,756 |
$140,406 |
$141,629 |
$152,084 |
$151,080 |
$138,941 |
$118,411 |
$138,032 |
$135,494 |
$136,380 |
$153,759 |
N/A |
| .
|
1. Retire Early Safe Withdrawal Study Portfolio (S&P500/Fixed Income)
Most of the various safe withdrawal studies done over the years assume some combination of an S&P500 index fund and fixed income assets. While the Retire Early study used 3-month commercial paper for the fixed income allocation, most retirees only keep one year's worth of expenses in a money market fund and the balance of their fixed income allocation in a ladder of CDs or bonds. To more closely model retirees' actual practice, an allocation of 4% of assets to Vanguard's Prime Reserve Money Market Fund (VMMXX) and 21% to Vanguard's Short-Term Corporate Bond Fund (VFSTX) was used for the 25% fixed income allocation.
|
Retire Early Safe Withdrawal Study Portfolio
75% S&P500, 25% Fixed Income, rebalanced annually
75% VFINX, 21% VFSTX, 4% VMMXX |
| Year |
1994 |
1995 |
1996 |
1997 |
1998 |
1999 |
2000 |
2001 |
2002 |
2003 |
2004 |
2005 |
2006 |
2007 |
2008 |
2009 |
2010 |
2011 |
2012 |
2013 |
2014 |
| Dec 31 Balance |
$100,000 |
$125,756 |
$144,002 |
$176,904 |
$212,405 |
$242,766 |
$226,770 |
$206,254 |
$170,402 |
$202,477 |
$214,423 |
$218,057 |
$240,383 |
$247,900 |
$172,849 |
$205,417 |
$224,165 |
$222,419 |
$244,461 |
$296,341 |
N/A |
| Annual Withdrawal (1) |
N/A |
$4,000 |
$4,109 |
$4,234 |
$4,301 |
$4,373 |
$4,492 |
$4,660 |
$4,713 |
$4,836 |
$4,929 |
$5,075 |
$5,277 |
$5,387 |
$5,618 |
$5,619 |
$5,767 |
$5,861 |
$6,032 |
$6,129 |
$6,225 |
| Percent of assets (2) |
N/A |
4.00% |
3.27% |
2.94% |
2.43% |
2.06% |
1.85% |
2.05% |
2.29% |
2.84% |
2.43% |
2.37% |
2.42% |
2.24% |
2.27% |
3.25% |
2.81% |
2.61% |
2.71% |
2.51% |
2.10% |
| Years in fixed income (3) |
N/A |
6.25 |
7.65 |
8.50 |
10.28 |
12.14 |
13.51 |
12.17 |
10.94 |
8.81 |
10.27 |
10.56 |
10.33 |
11.16 |
11.03 |
7.69 |
8.91 |
9.56 |
9.22 |
9.97 |
11.90 |
Notes
(1)....Dollar value of 4% of assets initial withdrawal indexed to the CPI-U in future years.
(2)....Annual withdrawal as a percent of previous year's Dec 31 balance.
(3)....Years' worth of annual withdrawals in fixed income assets (based on previous year's Dec 31 balance.)
|
|
Retirees following this approach over the past nineteen years have been generally pleased with the results. Even after taking nineteen years of inflation-adjusted withdrawals of over $100,000, the account balance has grown to $296,116 as of Dec 31, 2013. The 25% fixed income allocation has also grown from 6.25 years' worth of annual withdrawals to 9.97. The Jan 2013 withdrawal of $6,129 amounted to just 2.51% of assets.
2. One Fund Portfolio (Vanguard Balanced Index Fund (VBINX))
If even annual rebalancing of your retirement portfolio sounds like too much of a job, Vanguard's Balanced Index Fund may be a solution. The fund maintains a 60% allocation to the Wilshire 5000 Index and 40% to the Lehman Aggregate Bond Market Index. The expense ratio is 0.24%.
|
One Fund Portfolio (Vanguard Balanced Index Fund (VBINX)
60% S&P500, 40% Fixed Income, rebalanced continuously
100% VBINX |
| Year |
1994 |
1995 |
1996 |
1997 |
1998 |
1999 |
2000 |
2001 |
2002 |
2003 |
2004 |
2005 |
2006 |
2007 |
2008 |
2009 |
2010 |
2011 |
2012 |
2013 |
2014 |
| Dec 31 Balance |
$100,000 |
$123,494 |
$136,040 |
$161,119 |
$184,810 |
$204,995 |
$196,412 |
$185,982 |
$163,993 |
$190,782 |
$203,194 |
$207,331 |
$224,320 |
$232,420 |
$176,429 |
$205,058 |
$225,458 |
$228,688 |
$247,883 |
$285,052 |
N/A |
| Annual Withdrawal (1) |
N/A |
$4,000 |
$4,109 |
$4,234 |
$4,301 |
$4,373 |
$4,492 |
$4,660 |
$4,713 |
$4,836 |
$4,929 |
$5,075 |
$5,277 |
$5,387 |
$5,618 |
$5,619 |
$5,767 |
$5,861 |
$6,032 |
$6,129 |
$6,225 |
| Percent of assets (2) |
N/A |
4.00% |
3.33% |
3.11% |
2.67% |
2.37% |
2.19% |
2.37% |
2.53% |
2.95% |
2.58% |
2.50% |
2.55% |
2.40% |
2.42% |
3.18% |
2.81% |
2.60% |
2.64% |
2.47% |
2.18% |
| Years in fixed income (3) |
N/A |
10.00 |
12.02 |
12.85 |
14.99 |
16.91 |
18.25 |
16.86 |
15.78 |
13.57 |
15.48 |
16.01 |
15.71 |
16.66 |
16.55 |
12.56 |
14.22 |
15.39 |
15.16 |
16.18 |
18.32 |
Notes
(1)....Dollar value of 4% of assets initial withdrawal indexed to the CPI-U in future years.
(2)....Annual withdrawal as a percent of previous year's Dec 31 balance.
(3)....Years' worth of annual withdrawals in fixed income assets (based on previous year's Dec 31 balance.)
|
|
Retirees following this approach over the past nineteen years have been generally pleased with the results. Even after taking eighteen years of inflation-adjusted withdrawals, the account balance has grown to $285,052 as of Dec 31, 2013. The 40% fixed income allocation has also grown from 10.00 years' worth of annual withdrawals to 16.18. The Jan 2013 withdrawal of $6,129 amounted to just 2.47% of assets.
3. 100% Fixed Income
Some retirees just can't stomach the ups and downs of the stock market and prefer to keep all their retirement assets in fixed income securities. Few experts advise this, but folks do it anyway. Over the past nineteen years the 100% fixed income portfolio has steadily lost purchasing power to inflation and remains in last place overall. The January 2013 withdrawal amounted to 5.41% of assets. An allocation of 4% to Vanguard's Prime Reserve Money Market Fund (VMMXX) and 96% to Vanguard's Short-Term Corporate Bond Fund (VFSTX) was used for this all fixed income approach.
|
100% Fixed Income
100% Fixed Income, rebalanced annually
96% VFSTX, 4% VMMXX |
| Year |
1994 |
1995 |
1996 |
1997 |
1998 |
1999 |
2000 |
2001 |
2002 |
2003 |
2004 |
2005 |
2006 |
2007 |
2008 |
2009 |
2010 |
2011 |
2012 |
2013 |
2014 |
| Dec 31 Balance |
$100,000 |
$107,965 |
$108,851 |
$111,824 |
$114,537 |
$113,875 |
$118,237 |
$122,642 |
$123,916 |
$123,925 |
$121,459 |
$118,982 |
$119,373 |
$120,647 |
$109,910 |
$118,359 |
$118,227 |
$114,150 |
$113,296 |
$108,166 |
N/A |
| Annual Withdrawal (1) |
N/A |
$4,000 |
$4,109 |
$4,234 |
$4,301 |
$4,373 |
$4,492 |
$4,660 |
$4,713 |
$4,836 |
$4,929 |
$5,075 |
$5,277 |
$5,387 |
$5,618 |
$5,619 |
$5,767 |
$5,861 |
$6,032 |
$6,129 |
$6,225 |
| Percent of assets (2) |
N/A |
4.00% |
3.81% |
3.89% |
3.85% |
3.82% |
3.94% |
3.94% |
3.84% |
3.90% |
3.98% |
4.18% |
4.44% |
4.51% |
4.66% |
5.11% |
4.87% |
4.96% |
5.27% |
5.41% |
5.75% |
| Years in fixed income (3) |
N/A |
25.00 |
26.27 |
25.71 |
26.00 |
26.19 |
25.35 |
25.37 |
26.02 |
25.63 |
25.14 |
23.93 |
22.55 |
22.16 |
21.47 |
19.56 |
20.52 |
20.17 |
18.97 |
18.49 |
17.38 |
Notes
(1)....Dollar value of 4% of assets initial withdrawal indexed to the CPI-U in future years.
(2)....Annual withdrawal as a percent of previous year's Dec 31 balance.
(3)....Years' worth of annual withdrawals in fixed income assets (based on previous year's Dec 31 balance.)
|
|
Two prominent early retirees have followed the 100% fixed income approach. Your Money Or Your Life author Joe Dominguez invested in only US Treasury securities when he retired in 1969 at age 31 and continued to champion that approach up until his death in 1997. Dominguez retired in 1969 with a $100,000 portfolio and $7,000 per year in living expenses. An August 1996 Kiplinger's Personal Finance Magazine article revealed that Dominguez was then living on about $13,000 per year. To keep pace with inflation, $7,000 in 1969 would need to grow to $30,360 by 1996 to maintain the same purchasing power. Dominguez managed this loss of spending power with unusual living arrangements (he lived in a group home with about 30 other people) and a lot of composting and the washing and reusing of tin foil and wax paper -- a strategy that few early retirees would tolerate.
Paul Terhorst, author of Cashing in on the American Dream: Retire at 35 limited his investments to a laddered portfolio of FDIC-insured Certificates of Deposit (CDs) when he retired in 1984. His web site ( http://www.geocities.com/TheTropics/Shores/5315/ ) reveals he holds "a more traditional portfolio heavily weighted with low-cost [equity] index funds" today.
4. Modern Portfolio Theory (Asset Allocation)
Modern Portfolio Theory (MPT) holds that wide diversification among different asset classes increases investment returns. It was first advanced in the early 1950's by Princeton University Professor Harry M. Markowitz. He won the Nobel Prize in Economics in 1990 along with William F. Sharpe and Merton Miller for his work in portfolio diversification and investment returns. In recent years, author William J. Bernstein has popularized these concepts in his book The Intelligent Asset Allocator and on his web site http://www.efficientfrontier.com. Even Vanguard founder Jack Bogle recently relented and suggested that investors allocate "up to 20% of their stock market money to foreign shares." (Wall Street Journal, March 07, 2007)
To illustrate an MPT portfolio the nine-asset class Bernstein-inspired portfolio described in a December 2000 Smart Money magazine article was chosen. This portfolio covers the gamut from large cap to small cap US stocks, international equites, emerging markets, REITs, and short term bonds. The 40% allocation to Vanguard's Short-Term Corporate Bond Fund (VFSTX) was changed to 36% VFSTX and 4% Prime Money Market Fund (VMMXX) to provide the one year's worth of expenses in a money market fund that most retirees maintain.
|
Asset Allocation (MPT)
60% Stock/40% Fixed Income, rebalanced annually
15% VTSMX, 10% VISVX, 10% VIVAX, 5% VEIEX, 5% VEURX, 5% VPACX, 5% VGSIX, 5% NAESX
36% VFSTX, 4% VMMXX |
| Year |
1994 |
1995 |
1996 |
1997 |
1998 |
1999 |
2000 |
2001 |
2002 |
2003 |
2004 |
2005 |
2006 |
2007 |
2008 |
2009 |
2010 |
2011 |
2012 |
2013 |
2014 |
| Dec 31 Balance |
$100,000 |
$115,671 |
$127,214 |
$141,641 |
$146,591 |
$162,437 |
$161,756 |
$156,527 |
$141,155 |
$169,045 |
$184,450 |
$192,438 |
$214,734 |
$218,874 |
$161,639 |
$193,632 |
$212,531 |
$203,755 |
$221,658 |
$250,270 |
N/A |
| Annual Withdrawal (1) |
N/A |
$4,000 |
$4,109 |
$4,234 |
$4,301 |
$4,373 |
$4,492 |
$4,660 |
$4,713 |
$4,836 |
$4,929 |
$5,075 |
$5,277 |
$5,387 |
$5,618 |
$5,619 |
$5,767 |
$5,861 |
$6,032 |
$6,129 |
$6,225 |
| Percent of assets (2) |
N/A |
4.00% |
3.55% |
3.33% |
3.04% |
2.98% |
2.77% |
2.88% |
3.00% |
3.43% |
2.92% |
2.75% |
2.74% |
2.51% |
2.57% |
3.48% |
2.98% |
2.76% |
2.96% |
2.76% |
2.49% |
| Years in fixed income (3) |
N/A |
10.00 |
11.26 |
12.02 |
13.17 |
13.41 |
14.46 |
13.88 |
13.32 |
11.68 |
13.72 |
14.54 |
14.59 |
15.95 |
15.59 |
11.51 |
13.43 |
14.51 |
13.51 |
14.47 |
16.08 |
Notes
(1)....Dollar value of 4% of assets initial withdrawal indexed to the CPI-U in future years.
(2)....Annual withdrawal as a percent of previous year's Dec 31 balance.
(3)....Years' worth of annual withdrawals in fixed income assets (based on previous year's Dec 31 balance.)
|
|
While the MPT portfolio value has trailed the simple S&P500/fixed income portfolio (No. 1 above) by 18% as of Dec 31, 2013, advocates of this approach like its reduced volatility and sterling academic recommendations. Which brings us to an important investing truism -- it's OK to under perform as long as you're pleased with the results and proud of what you are doing.
Concentrated Portfolios
The efficient market theorists don't like it, and warn that it's too risky, but many investors eschew index funds and hold individual stocks or concentrate on one or more industry sectors. Most of the research I've seen shows that no more than 20% of the people who hold individual stocks out perform the S&P500. If you're a member of this minority, obviously you're pleased. Here's a couple of concentrated portfolios I've followed over the years.
5. Warren Buffett Portfolio (BRKa/Fixed Income)
Warren Buffett ranked number 4 on the list of world's richest people in 2013, though he's hardly hurting with $53.4 billion of his wealth intact. It's even more noteable that he's one of the few members of the Forbes 400 who got there by investing in stocks rather than founding a successful business or inheriting his fortune. His investment strategy is to buy and hold positions in a few companies and watch them very carefully. Just four stocks (Coca-Cola, IBM, American Express and Wells Fargo) make up more than half the value of Berkshire's $118 billion stock portfolio.
| Berkshire Hathaway's Investment Portfolio (as of Dec. 31, 2013) |
| Shares |
Company |
Cost |
Market |
| . |
. |
(dollars in millions) |
| 151,610,700 | American Express Company | $ 1,287 | $ 13,756 |
| 400,000,000 | The Coca-Cola Company | 1,299 | 16,524 |
| 24,123,911 | Conoco Phillips | 1,219 | 1,399 |
| 22,238,900 | DIRECTV | 1,017 | 1,536 |
| 41,129,643 | Exxon Mobil Corp | 3,737 | 4,162 |
| 13,062,594 | The Goldman Sachs Group, Inc. | 750 | 2,315 |
| 68,121,984 | International Business Machines Corp | 11,681 | 12,778 |
| 22,669,778 | Moody's Corporation | 248 | 1,936 |
| 20,060,390 | Munich Re | 2,990 | 4,415 |
| 20,668,118 | Phillips 66 | 660 | 1,594 |
| 52,477,678 | The Procter & Gamble Company | 336 | 4,272 |
| 22,169,930 | Sanofi | 1,747 | 2,354 |
| 301,046,076 | Tesco | 1,699 | 1,666 |
| 96,117,069 | US Bancorp | 3,002 | 3,883 |
| 56,805,984 | Wal-Mart Stores, Inc. | 2,976 | 4,470 |
| 483,470,853 | Wells Fargo & Company | 11,871 | 21,950 |
| . | Others | 11,281 | 19,894 |
| . | Total Common Stocks | $56,581 | $117,505 |
For the purposes of a retirement portfolio, a mix of 75% Berkshire Hathaway stock, 4% money market fund and 21% short-term corporate bond fund was chosen for the example below. Through December 31, 2013, the value of the Warren Buffet portfolio exceeded the S&P500/fixed income portfolio by 50%. .
|
Warren Buffett Portfolio
75% Stock/25% Fixed Income, rebalanced annually
75% BRKa
21% VFSTX, 4% VMMXX |
| Year |
1994 |
1995 |
1996 |
1997 |
1998 |
1999 |
2000 |
2001 |
2002 |
2003 |
2004 |
2005 |
2006 |
2007 |
2008 |
2009 |
2010 |
2011 |
2012 |
2013 |
2014 |
| Dec 31 Balance |
$100,000 |
$140,120 |
$144,022 |
$178,711 |
$245,434 |
$207,327 |
$247,230 |
$258,910 |
$249,963 |
$276,444 |
$284,813 |
$283,087 |
$331,498 |
$401,128 |
$297,713 |
$306,655 |
$352,525 |
$335,778 |
$375,001 |
$442,774 |
N/A |
| Annual Withdrawal (1) |
N/A |
$4,000 |
$4,109 |
$4,234 |
$4,301 |
$4,373 |
$4,492 |
$4,660 |
$4,713 |
$4,836 |
$4,929 |
$5,075 |
$5,277 |
$5,387 |
$5,618 |
$5,619 |
$5,767 |
$5,861 |
$6,032 |
$6,129 |
$6,225 |
| Percent of assets (2) |
N/A |
4.00% |
2.93% |
2.94% |
2.41% |
1.78% |
2.17% |
1.88% |
1.82% |
1.93% |
1.78% |
1.78% |
1.86% |
1.62% |
1.40% |
1.89% |
1.88% |
1.66% |
1.80% |
1.63% |
1.41% |
| Years in fixed income (3) |
N/A |
6.25 |
8.52 |
8.50 |
10.39 |
14.30 |
11.54 |
13.26 |
13.73 |
12.92 |
14.02 |
14.03 |
13.41 |
15.39 |
17.85 |
13.25 |
13.29 |
15.04 |
13.92 |
15.30 |
17.78 |
Notes
(1)....Dollar value of 4% of assets initial withdrawal indexed to the CPI-U in future years.
(2)....Annual withdrawal as a percent of previous year's Dec 31 balance.
(3)....Years' worth of annual withdrawals in fixed income assets (based on previous year's Dec 31 balance.)
|
|
If you want to learn more about how Mr. Buffett selects stocks, one good book on the subject is Buffettology by his daughter-in-law Mary Buffett .
6. Harry Browne Permanent Portfolio
Harry Browne is an investment advisor who was the Libertarian candidate for President in 1996 and 2000. His Permanent Portfolio is equally allocated to four asset classes (Cash, Long-Term Treasury Bonds, Precious Metals, and U.S. Stocks) and rebalanced anually. His investment philosophy is outlined in his 1999 book Fail Safe Investing. The Permanent Portfolio's outsized bets on Long-Term Treasury Bonds and Gold (Precious Metals) had made it a big winner in 2010 and 2011. However, the big drop in the price of gold during 2012 made the Harry Browne portfolio a loser this year. Look for a rise in interest rates to inflect similar damage on its big allocation to Long-Term Treasuries.
|
Harry Browne Portfolio
25% Stock/25% Cash/25% Fixed Income/25% Precious Metals, rebalanced annually
25% VFINX, 25% VMMXX, 25% VUSTX, 25% VGPMX |
| Year |
1994 |
1995 |
1996 |
1997 |
1998 |
1999 |
2000 |
2001 |
2002 |
2003 |
2004 |
2005 |
2006 |
2007 |
2008 |
2009 |
2010 |
2011 |
2012 |
2013 |
2014 |
| Dec 31 Balance |
$100,000 |
$110,778 |
$135,564 |
$156,784 |
$195,699 |
$269,874 |
$300,891 |
$350,527 |
$325,414 |
$310,443 |
$347,754 |
$386,571 |
$406,019 |
$441,268 |
$332,216 |
$336,572 |
$421,395 |
$406,273 |
$388,833 |
$414,116 |
N/A |
| Annual Withdrawal (1) |
N/A |
$4,000 |
$4,109 |
$4,234 |
$4,301 |
$4,373 |
$4,492 |
$4,660 |
$4,713 |
$4,836 |
$4,929 |
$5,075 |
$5,277 |
$5,387 |
$5,618 |
$5,619 |
$5,767 |
$5,861 |
$6,032 |
$6,129 |
$6,225 |
| Percent of assets (2) |
N/A |
4.00% |
3.71% |
3.12% |
2.74% |
2.23% |
1.66% |
1.55% |
1.34% |
1.49% |
1.59% |
1.46% |
1.37% |
1.33% |
1.27% |
1.69% |
1.71% |
1.39% |
1.48% |
1.58% |
1.50% |
| Years in fixed income (3) |
N/A |
12.50 |
13.48 |
16.01 |
18.23 |
22.38 |
30.04 |
32.28 |
37.19 |
33.65 |
31.49 |
34.26 |
36.62 |
37.69 |
39.28 |
29.56 |
29.18 |
35.95 |
33.67 |
31.72 |
33.26 |
Notes
(1)....Dollar value of 4% of assets initial withdrawal indexed to the CPI-U in future years.
(2)....Annual withdrawal as a percent of previous year's Dec 31 balance.
(3)....Years' worth of annual withdrawals in fixed income assets (based on previous year's Dec 31 balance.)
|
|
Harry Browne is the author of thirteen books on investing and economics. Here's a sample.
7. Harry Dent Portfolio
Harry Dent made perhaps the most prescient forecast of the great bull market of the 1990's in his 1993 book The Great Boom Ahead. His theory of demographic investing sees the Dow Jones average hitting 41,000 by the year 2008. (He revised that to a Dow of 20,000 in late 2006, click here.) The chart below summarizes Dent's long-term forecast.
Dent favors three sectors of the economy during the 1982-2008 boom: technology, health care, and financial services. More troubling is the 12-14 year long recession/depression from 2009 to 2022. The deflation during that period will make long-term US Treasury securities the investment of choice.
Three sector funds were used to build the Harry Dent portfolio below. The Vanguard Health Care Fund (VGHCX) was chosen for its low expense ratio. Since Vanguard doesn't offer similiar specialized funds in other areas, the Fidelity Computer Technology (FDCPX) and Financial Services (FIDSX) sector funds were selected as a convenient choice.
|
Harry Dent Portfolio
75% Stock/25% Fixed Income, rebalanced annually
25% FIDSX, 25% FDCPX, 25% VGHCX
21% VFSTX, 4% VMMXX |
| Year |
1994 |
1995 |
1996 |
1997 |
1998 |
1999 |
2000 |
2001 |
2002 |
2003 |
2004 |
2005 |
2006 |
2007 |
2008 |
2009 |
2010 |
2011 |
2012 |
2013 |
2014 |
| Dec 31 Balance |
$100,000 |
$131,349 |
$155,859 |
$180,948 |
$246,282 |
$298,324 |
$342,689 |
$307,762 |
$257,469 |
$330,648 |
$342,559 |
$360,998 |
$392,549 |
$405,623 |
$279,573 |
$371,125 |
$402,612 |
$385,095 |
$437,455 |
$548,612 |
N/A |
| Annual Withdrawal (1) |
N/A |
$4,000 |
$4,109 |
$4,234 |
$4,301 |
$4,373 |
$4,492 |
$4,660 |
$4,713 |
$4,836 |
$4,929 |
$5,075 |
$5,277 |
$5,387 |
$5,618 |
$5,619 |
$5,767 |
$5,861 |
$6,032 |
$6,129 |
$6,225 |
| Percent of assets (2) |
N/A |
4.00% |
3.13% |
2.72% |
2.38% |
1.78% |
1.51% |
1.36% |
1.53% |
1.88% |
1.49% |
1.48% |
1.46% |
1.37% |
1.39% |
2.01% |
1.55% |
1.46% |
1.57% |
1.40% |
1.13% |
| Years in fixed income (3) |
N/A |
6.25 |
7.99 |
9.20 |
10.52 |
14.08 |
16.60 |
18.38 |
16.32 |
13.31 |
16.77 |
16.87 |
17.10 |
18.22 |
18.05 |
12.44 |
16.09 |
17.17 |
15.96 |
17.84 |
22.03 |
Notes
(1)....Dollar value of 4% of assets initial withdrawal indexed to the CPI-U in future years.
(2)....Annual withdrawal as a percent of previous year's Dec 31 balance.
(3)....Years' worth of annual withdrawals in fixed income assets (based on previous year's Dec 31 balance.)
|
|
Harry Dent has written four books on demographic investing. The first book, The Great Boom Ahead is the best. Like most sequels, the subsequent installments lack the impact of the original work.
8. Larry Swedroe Portfolio
Larry Swedroe's mix of 30% small-cap value and 70% one-year US Treasuries seeks to provide a return close to that of the S&P500 with less volatility. Historically small cap stocks have beat the return of the S&P500 by about 4% per annum, so you can get the same "bang" with a smaller stock allocation. The Larry Portfolio has matched up well with the other 3 broadly diversified portfolios over the past 19 years.
|
Larry Swedroe Portfolio
30% Small Cap Value Stocks/70% One-Year US Treasuries, rebalanced annually
30% VISVX, 70% 1-YR US Treasuries |
| Year |
1994 |
1995 |
1996 |
1997 |
1998 |
1999 |
2000 |
2001 |
2002 |
2003 |
2004 |
2005 |
2006 |
2007 |
2008 |
2009 |
2010 |
2011 |
2012 |
2013 |
2014 |
| Dec 31 Balance |
$100,000 |
$108,691 |
$124,340 |
$140,841 |
$139,895 |
$148,299 |
$174,219 |
$167,492 |
$147,870 |
$152,492 |
$178,147 |
$186,860 |
$204,802 |
$212,176 |
$195,186 |
$170,712 |
$202,248 |
$204,337 |
$208,953 |
$239,283 |
N/A |
| Annual Withdrawal (1) |
N/A |
$4,000 |
$4,109 |
$4,234 |
$4,301 |
$4,373 |
$4,492 |
$4,660 |
$4,713 |
$4,836 |
$4,929 |
$5,075 |
$5,277 |
$5,387 |
$5,618 |
$5,619 |
$5,767 |
$5,861 |
$6,032 |
$6,129 |
$6,225 |
| Percent of assets (2) |
N/A |
4.00% |
3.78% |
3.41% |
3.05% |
3.13% |
3.03% |
2.67% |
2.81% |
3.27% |
3.23% |
2.85% |
2.82% |
2.63% |
2.65% |
2.88% |
3.38% |
2.90% |
2.95% |
2.93% |
2.60% |
| Years in fixed income (3) |
N/A |
17.50 |
18.52 |
20.56 |
22.92 |
22.40 |
23.11 |
26.17 |
24.88 |
21.41 |
21.66 |
24.57 |
24.79 |
26.61 |
26.44 |
24.31 |
20.72 |
24.16 |
23.71 |
23.87 |
26.91 |
Notes
(1)....Dollar value of 4% of assets initial withdrawal indexed to the CPI-U in future years.
(2)....Annual withdrawal as a percent of previous year's Dec 31 balance.
(3)....Years' worth of annual withdrawals in fixed income assets (based on previous year's Dec 31 balance.)
|
|
Larry Swedroe is the author of a dozen books on investing. Here are a few of his most recent titles.
How about some losing portfolios?
There's no shortage of losing strategies you could have employed over the past eighteen years. Market timing, day trading, Internet stocks with no record of earnings, etc. likely would have lost you money unless you were one of the fortunate few who sold out at the top. Retirees who see the value in holding at least 5 years' worth of expenses in cash and CDs and maintain some level of diversification in their portfolios would have rejected most of these losing investment approaches on principle alone.
What if you retired in January 2000?
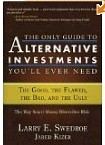
If you happened to retire in January 2000, the last twelve years haven't been pleasant. Only the Warren Buffett portfolio and Harry Browne Portfolio has a value appreciably exceeding its $100,000 starting balance. The 100% fixed income portfolio is underwater while the MPT portfolio and Larry Swedroe Portfolio are treading it. The other three portfolios all show losses. The worst performer was the 75% S&P500/25% fixed income portfolio which is now less than two-thirds of its starting value . The chart below illustrates this performance.
What to conclude from these results? There's a reason Warren Buffett is regarded as the most successful stock market investor of all time -- and Harry Browne's big bet on gold and Long-Term Treasuries has worked out well, too -- so far. But even someone with a fairly pedestrian 60% S&P500/40% fixed income portfolio, who retired in 2000 at the market top, still has almost 90% of his starting value after 13 years of inflation-adjusted withdrawals, the bursting of the stock market and housing bubbles, and the economic collapse in the waning days of the Bush Admininstration. Pretty amazing.
![[Chart]](reallife14a.jpg)
|
Real-Life Retiree Returns
Dec 31 Portfolio Values, $100,000 starting balance,
4% initial inflation-adjusted withdrawal rate |
| Year |
1999 |
2000 |
2001 |
2002 |
2003 |
2004 |
2005 |
2006 |
2007 |
2008 |
2009 |
2010 |
2011 |
2012 |
2013 |
2014 |
| Annual Withdrawal |
N/A |
$4,000 |
$4,149 |
$4,197 |
$4,306 |
$4,389 |
$4,519 |
$4,699 |
$4,796 |
$5,002 |
$5,003 |
$5,135 |
$5,219 |
$5,371 |
$5,457 |
$5,543 |
| 75% S&P500/25% FI |
$100,000 |
$91,365 |
$80,990 |
$64,928 |
$74,137 |
$75,707 |
$74,149 |
$78,460 |
$77,700 |
$51,870 |
$57,569 |
$58,873 |
$54,665 |
$55,690 |
$62,459 |
N/A |
| One Fund 60%/40% |
$100,000 |
$94,042 |
$87,178 |
$75,081 |
$84,838 |
$87,956 |
$87,317 |
$91,722 |
$92,281 |
$67,894 |
$75,500 |
$79,604 |
$77,465 |
$80,262 |
$88,203 |
N/A |
| 100% Fixed Income |
$100,000 |
$103,771 |
$107,573 |
$108,625 |
$108,563 |
$106,330 |
$104,084 |
$104,340 |
$105,349 |
$95,892 |
$103,149 |
$102,919 |
$99,513 |
$98,377 |
$93,786 |
N/A |
| MPT Portfolio |
$100,000 |
$98,316 |
$94,059 |
$83,340 |
$98,008 |
$105,218 |
$108,033 |
$118,558 |
$118,938 |
$86,359 |
$100,968 |
$108,416 |
$101,741 |
$108,036 |
$119,114 |
N/A |
| Warren Buffett Portfolio |
$100,000 |
$117,012 |
$120,465 |
$114,332 |
$124,083 |
$125,556 |
$122,487 |
$140,551 |
$166,966 |
$121,928 |
$122,753 |
$137,804 |
$128,422 |
$139,938 |
$161,424 |
N/A |
| Harry Browne Portfolio |
$100,000 |
$96,770 |
$96,046 |
$98,628 |
$115,905 |
$119,060 |
$131,202 |
$144,390 |
$159,102 |
$127,999 |
$151,110 |
$168,364 |
$167,061 |
$165,857 |
$154,000 |
N/A |
| Harry Dent Portfolio |
$100,000 |
$110,213 |
$96,567 |
$78,477 |
$97,076 |
$97,480 |
$99,438 |
$104,547 |
$104,495 |
$69,546 |
$87,436 |
$90,693 |
$82,984 |
$89,545 |
$106,953 |
N/A |
| Larry Swedroe Portfolio |
$100,000 |
$105,892 |
$100.399 |
$87,305 |
$88,411 |
$101,623 |
$104,901 |
$113,074 |
$115,298 |
$104,282 |
$89,016 |
$103,170 |
$102,032 |
$101,844 |
$113,885 |
N/A |
| .
|
|
![[Retire Early]](retire.gif)
![[Retire Early]](ademail.jpg)